Diagnostics
Autofac 6.0 introduced diagnostics support in the form of System.Diagnostics.DiagnosticSource. This allows you to intercept diagnostic events from Autofac.
Note
Diagnostics aren’t free. You will get better performance if you don’t have a diagnostic listener attached to the container. Further, tracers like DefaultDiagnosticTracer that generate a full trace of an operation will increase memory and resource usage as they have to hold onto data during the entire resolve operation in order to generate a complete trace. It is recommended you only use diagnostics in a non-production environment; or use diagnostics listeners that handle individual events without tracking full operations.
Quick Start
The easiest way to get started with diagnostics is to use the Autofac.Diagnostics.DefaultDiagnosticTracer class. This tracer will generate a hierarchical trace of resolution operations that you can use in troubleshooting.
// Build your container as you normally would.
var containerBuilder = new ContainerBuilder();
containerBuilder.RegisterType<Component>().As<IService>();
var container = containerBuilder.Build();

// Create a tracer instance and figure out
// what you want to do when a trace is ready
// to be viewed.
var tracer = new DefaultDiagnosticTracer();
tracer.OperationCompleted += (sender, args) =>
{
    Trace.WriteLine(args.TraceContent);
};

// Subscribe to the diagnostics with your tracer.
container.SubscribeToDiagnostics(tracer);

// Resolve things as normal. The tracer
// event will be raised whenever something
// is resolved.
using var scope = container.BeginLifetimeScope();
scope.Resolve<IService>();
If you don’t have direct access to the container (e.g., in ASP.NET Core) you can use a build callback to register the tracer.
public void ConfigureContainer(ContainerBuilder builder)
{
    // Register Autofac things as you normally would.
    builder.RegisterModule(new AutofacModule());

    // Create a tracer instance and figure out
    // what you want to do when a trace is ready
    // to be viewed. Note: since you're diagnosing
    // the container you probably shouldn't ALSO
    // resolve the logger to which the diagnostics
    // get written.
    var tracer = new DefaultDiagnosticTracer();
    tracer.OperationCompleted += (sender, args) =>
    {
        Console.WriteLine(args.TraceContent);
    };

    builder.RegisterBuildCallback(c =>
    {
        var container = c as IContainer;
        container.SubscribeToDiagnostics(tracer);
    });
}
Default Diagnostic Tracer
The quick start above shows how you can get going with the Autofac.Diagnostics.DefaultDiagnosticTracer.
When the OperationCompleted event gets raised, you’ll get event arguments that provide:
Operation- the actual resolve operation that completed so you can inspect it if needed.OperationSucceeded- a Boolean value indicating whether the contained trace is for a successful or failed operation.TraceContent- the built string that has the full trace of the resolve operation.
Let’s say you have a simple lambda that registers a string.
var builder = new ContainerBuilder();
builder.Register(ctx => "HelloWorld");
var container = builder.Build();
If you resolve a string from that container, the trace will look like this:
Resolve Operation Starting
{
  Resolve Request Starting
  {
    Service: System.String
    Component: λ:System.String

    Pipeline:
    -> CircularDependencyDetectorMiddleware
      -> ScopeSelectionMiddleware
        -> SharingMiddleware
          -> RegistrationPipelineInvokeMiddleware
            -> ActivatorErrorHandlingMiddleware
              -> DisposalTrackingMiddleware
                -> λ:System.String
                <- λ:System.String
              <- DisposalTrackingMiddleware
            <- ActivatorErrorHandlingMiddleware
          <- RegistrationPipelineInvokeMiddleware
        <- SharingMiddleware
      <- ScopeSelectionMiddleware
    <- CircularDependencyDetectorMiddleware
  }
  Resolve Request Succeeded; result instance was HelloWorld
}
Operation Succeeded; result instance was HelloWorld
As you can see, the trace is very detailed - you can see the full middleware pipeline that the resolve operation went through, you’ll see the activator (a delegate, in this case), and you’ll see the resulting instance.
This can really help when trying to troubleshoot complex resolve issues, though the amount of information can be overwhelming the more complex the trace gets.
An error trace will include where the error occurred and indicate failure:
Resolve Operation Starting
{
  Resolve Request Starting
  {
    Service: System.String
    Component: λ:System.String

    Pipeline:
    -> CircularDependencyDetectorMiddleware
      -> ScopeSelectionMiddleware
        -> SharingMiddleware
          -> RegistrationPipelineInvokeMiddleware
            -> ActivatorErrorHandlingMiddleware
              -> DisposalTrackingMiddleware
                -> λ:System.String
                X- λ:System.String
              X- DisposalTrackingMiddleware
            X- ActivatorErrorHandlingMiddleware
          X- RegistrationPipelineInvokeMiddleware
        X- SharingMiddleware
      X- ScopeSelectionMiddleware
    X- CircularDependencyDetectorMiddleware
  }
  Resolve Request FAILED
    System.DivideByZeroException: Attempted to divide by zero.
      at MyProject.MyNamespace.MyMethod.<>c.<GenerateSimpleTrace>b__6_0(IComponentContext x) in /path/to/MyCode.cs:line 39
      at Autofac.RegistrationExtensions.<>c__DisplayClass39_0`1.<Register>b__0(IComponentContext c, IEnumerable`1 p)
      at Autofac.Builder.RegistrationBuilder.<>c__DisplayClass0_0`1.<ForDelegate>b__0(IComponentContext c, IEnumerable`1 p)
      at Autofac.Core.Activators.Delegate.DelegateActivator.ActivateInstance(IComponentContext context, IEnumerable`1 parameters)
      at Autofac.Core.Activators.Delegate.DelegateActivator.<ConfigurePipeline>b__2_0(ResolveRequestContext ctxt, Action`1 next)
      at Autofac.Core.Resolving.Middleware.DelegateMiddleware.Execute(ResolveRequestContext context, Action`1 next)
      at Autofac.Core.Resolving.Pipeline.ResolvePipelineBuilder.<>c__DisplayClass14_0.<BuildPipeline>b__1(ResolveRequestContext ctxt)
      at Autofac.Core.Resolving.Middleware.DisposalTrackingMiddleware.Execute(ResolveRequestContext context, Action`1 next)
      at Autofac.Core.Resolving.Pipeline.ResolvePipelineBuilder.<>c__DisplayClass14_0.<BuildPipeline>b__1(ResolveRequestContext ctxt)
      at Autofac.Core.Resolving.Middleware.ActivatorErrorHandlingMiddleware.Execute(ResolveRequestContext context, Action`1 next)
}
Operation FAILED
See how the return trip through the middleware changed to a X- in there? We know the error happened while executing the lambda. You can use these hints to see exactly where in the pipeline things are failing.
DOT Graph Tracer
In addition to the DefaultDiagnosticTracer we provide a graphing tracer in the Autofac.Diagnostics.DotGraph package.
If you add a reference to this package, you’ll have the ability to trace out full dependency trees in a visual fashion using DOT language. You can then render images with a tool like Graphviz.
First, just like with the DefaultDiagnosticTracer, register it with your container. This time the trace output will be a DOT graph.
// Build your container as you normally would.
var containerBuilder = new ContainerBuilder();
containerBuilder.RegisterType<Component>().As<IService>();
var container = containerBuilder.Build();

// Create a DOT graph tracer instance. The
// trace content will be DOT graph format.
var tracer = new DotDiagnosticTracer();
tracer.OperationCompleted += (sender, args) =>
{
    // Writing the DOT trace to a file will let you render
    // it to a graph with Graphviz later, but this is
    // NOT A GOOD COPY/PASTE EXAMPLE. You'll want to do
    // things in an async fashion with good error handling.
    var path = Path.Combine(Path.GetTempPath(), $"{Guid.NewGuid()}.dot");
    using var file = new StreamWriter(path);
    file.WriteLine(args.TraceContent);
};

// Subscribe to the diagnostics with your tracer.
container.SubscribeToDiagnostics(tracer);

// Resolve things as normal. The tracer
// event will be raised whenever something
// is resolved.
using var scope = container.BeginLifetimeScope();
scope.Resolve<IService>();
Let’s say you have a simple lambda that registers a string.
var builder = new ContainerBuilder();
builder.Register(ctx => "HelloWorld");
var container = builder.Build();
The output from the DOT graph tracer will look like this (and, yes, it’s messy):
digraph G {
label=<string<br/><font point-size="8">Operation #1</font>>;
labelloc=t
na58baa0161f74ca8a74d3481aff7d182 [shape=component,label=<
<table border='0' cellborder='0' cellspacing='0'>
<tr><td port='nb569aeb076c94321a3c17b56bf16fd2c'>string</td></tr>
<tr><td><font point-size="10">Component: λ:string</font></td></tr>
</table>
>];
}
However, let’s say you save that to a file and then convert it to a PNG with Graphviz:
dot -Tpng -O my-trace.dot
The graphic output looks like this:
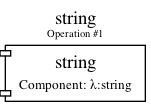
Simple DOT graph for a string resolve.
Now it’s looking interesting. We can see the resolve was for a string and we can see the request was fulfilled by a lambda.
But what about something more complex? Here’s an example of what a complex resolution graph might look like.
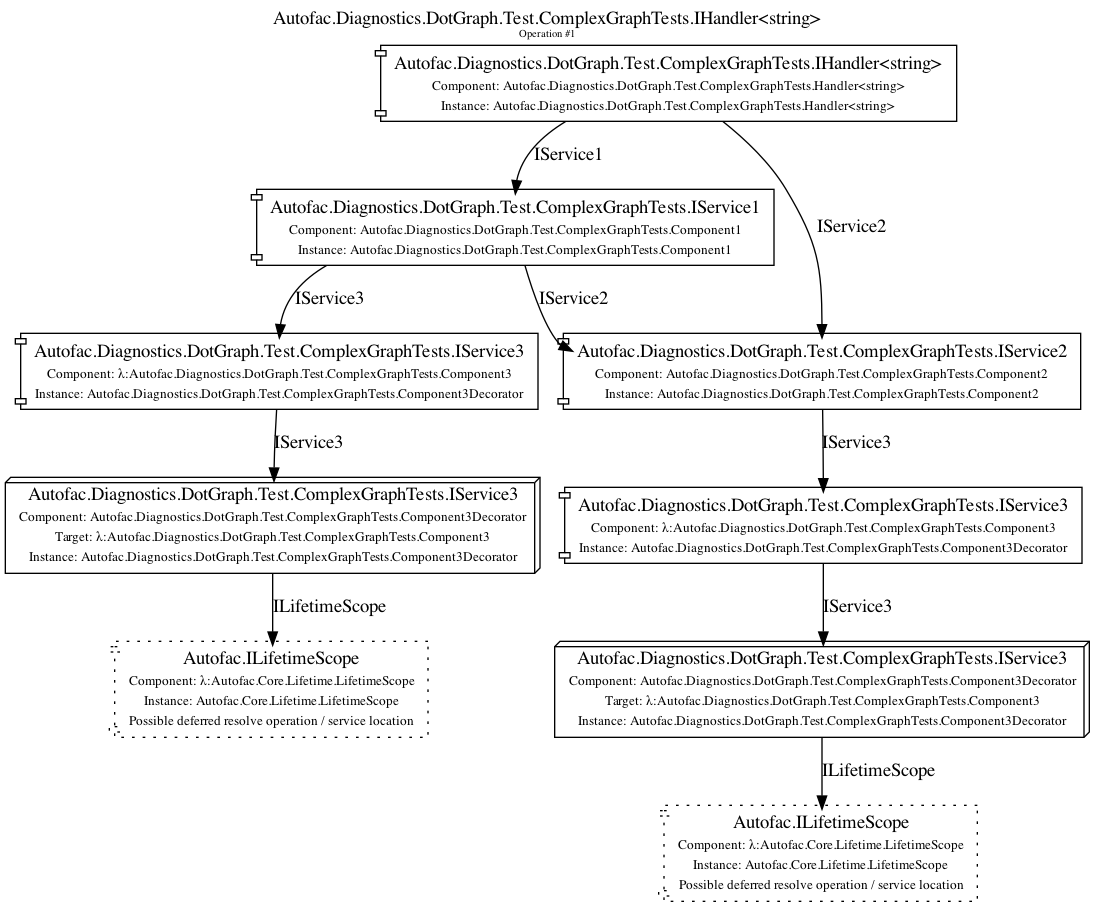
DOT graph for a complex resolve.
Looking at this graph, it tells us a lot of things:
Both the
IHandler<string>and theIService1that was resolved need anIService2and it was fulfilled by a single instance. That means it’s either a singleton or maybe an instance-per-lifetime-scope.Both the
IService1andIService2need anIService3and a new one was created for each instance.IService3is decorated - see how it chains down to a node that looks more like a box? That indicates there’s a decorator in play. You can see the component (the decorator) and the target (the thing being decorated) listed in that box.IService3takes in anILifetimeScopeconstructor parameter.
That last one - the ILifetimeScope parameter - means IService3 might do some service location (manually resolve something) inside the code. If you really want to know the full chain, you might have to correlate this graph with others. But how?
Notice at the top there’s an Operation #1 counter - this counter increments for every resolve operation passing through the tracer. You can look for traces that have a larger number and do a little manual correlation. Unfortunately, this is the best we can offer because each resolution is entirely independent - service location breaks the chain. You can’t assume all resolves associated with a lifetime scope are correlated because, for example, maybe all the resolutions for an entire application come from a single scope.
Errors will also be highlighted so you can see where the error occurs.
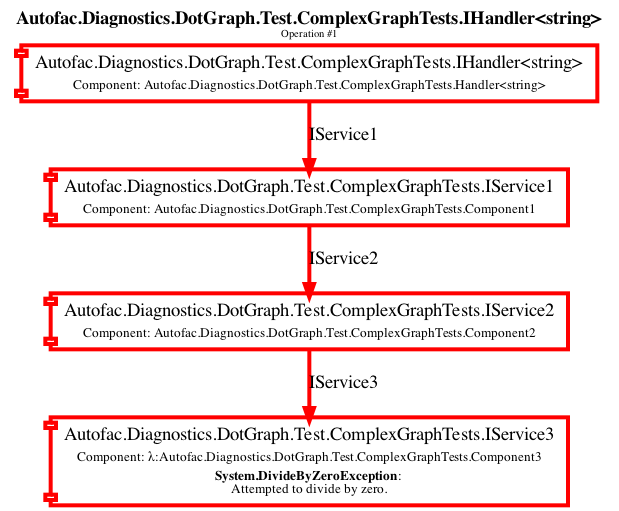
DOT graph for an error during a resolve.
In this case, you can see the trace all the way down to the location where it failed is highlighted red and bold. You can also see the exception type and message.
Custom Tracers
Using System.Diagnostics.DiagnosticSource in Autofac allows you to create your own custom tracer that can handle various events and generate the data that interests you.
Events in the overall pipeline happen in this order:
- Operation start
- Resolve request start
Middleware start
Middleware success / fail
Resolve request success / fail
Operation success / fail
Middleware may start additional resolve requests; and there’s more than one middleware item in the pipeline. You can dig deeper on this in the Pipelines page.
If you want to trace an entire operation from end to end, similar to the DefaultDiagnosticTracer, you can start with the Autofac.Diagnostics.OperationDiagnosticTracerBase<TContent> class. This is the class on which the DefaultDiagnosticTracer is based. It is intentionally wired up to listen to all resolve events, from start to end, and track a full operation at a time. Your best example of this is to look at the source code for DefaultDiagnosticTracer. Given there are a lot of events to handle, there’s a lot of data to capture.
You can take a little more control and trace only certain events by using Autofac.Diagnostics.DiagnosticTracerBase. This is a DiagnosticListener that adds some strongly-typed parsing to the events to help you write a little less code. Here’s a tracer that logs to console when a resolve operation starts:
Here’s an example tracer that traces full operations and just keeps a simple stack of data similar to the DefaultDiagnosticTracer but far less fancy.
public class ConsoleOperationTracer : DiagnosticTracerBase
{
    public ConsoleOperationTracer()
        : base()
    {
        EnableBase("Autofac.Operation.Start");
    }

    protected override void OnOperationStart(OperationStartDiagnosticData data)
    {
        Console.WriteLine("Operation starting.");
    }
}
Now you can use your custom tracer. It won’t raise any event, but it’ll log what you want.
// Build your container as you normally would.
var containerBuilder = new ContainerBuilder();
containerBuilder.RegisterType<Component>().As<IService>();
var container = containerBuilder.Build();

// Subscribe to the diagnostics with your tracer.
container.SubscribeToDiagnostics<ConsoleOperationTracer>();
If you want even more control you can use the standard IObserver<KeyValuePair<string, object>> support that System.Diagnostics.DiagnosticListener uses by default. Here’s that same console logging listener in that format:
public class ConsoleOperationTracer : IObserver<KeyValuePair<string, object>>
{
    public void OnCompleted()
    {
    }

    public void OnError(Exception error)
    {
    }

    public void OnNext(KeyValuePair<string, object> value)
    {
        // The tracer will only be called on operation start
        // because that's how we're going to register it.
        //
        // value.Value is an OperationStartDiagnosticData when
        // the operation start event is raised, but this logger
        // doesn't use that.
        Console.WriteLine("Operation starting.");
    }
}
As you can see, you can write some very tight, performant code if you get down to the metal.
When you get this low, you can control the subscriptions for your events separately from the tracer. You have to register your tracer directly with the container DiagnosticSource.
// Subscribe to the diagnostics with your tracer.
// Note the lambda that tells how to determine if
// the tracer should get an event.
var tracer = new ConsoleOperationTracer();
container.DiagnosticSource.Subscribe(tracer, e => e == "Autofac.Operation.Start");
Symbols and Sources
Autofac packages have been updated to use Source Link so you can debug right from your code into the Autofac source. Packages may have the symbols right inside or they may be in the NuGet Symbol Server.
In Visual Studio, there’s an option to enable searching the NuGet symbol server. See the documentation from Microsoft explaining how to configure Visual Studio to make symbol servers work.
In VS Code, you may need to set the debugging options up in settings.json or launch.json.
A settings.json block to enable symbols during unit test debugging looks like this:
{
  "csharp.unitTestDebuggingOptions": {
    "symbolOptions": {
      "searchMicrosoftSymbolServer": true,
      "searchNuGetOrgSymbolServer": true
    }
  }
}
To launch your application with symbols enabled, launch.json might look something like this:
{
  "configurations": [
    {
      "console": "internalConsole",
      "cwd": "${workspaceFolder}/src/MyProject",
      "env": {
        "ASPNETCORE_ENVIRONMENT": "Development",
        "ASPNETCORE_URLS": "https://localhost:5000",
        "COMPlus_ReadyToRun": "0",
        "COMPlus_ZapDisable": "1"
      },
      "justMyCode": false,
      "name": "Launch with SourceLink (Development)",
      "preLaunchTask": "build",
      "program": "${workspaceFolder}/src/MyProject/bin/Debug/net6.0/MyProject.dll",
      "request": "launch",
      "serverReadyAction": {
        "action": "openExternally",
        "pattern": "\\bNow listening on:\\s+(https?://\\S+)",
        "uriFormat": "%s"
      },
      "stopAtEntry": false,
      "suppressJITOptimizations": true,
      "symbolOptions": {
        "searchMicrosoftSymbolServer": true,
        "searchNuGetOrgSymbolServer": true
      },
      "type": "coreclr"
    }
  ],
  "version": "0.2.0"
}